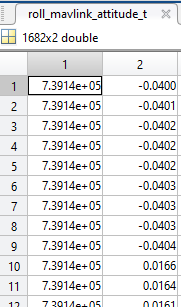
So I have the roll_mavlink_attitude_t matrix open in MATLAB. Is the left column the time and is the right column the actual roll angle? Also, if the left column is time, is it in seconds?
Since it has been 5 days I’ll take a stab at this; I am not sure though. I believe it is serial time (https://github.com/ArduPilot/MissionPlanner/blob/fdb080ea838bb49dcbcdaef2032c3b9f4befdfbd/ExtLibs/Utilities/MatLab.cs#L394C1-L400C32).
You should be able to explore the code base in the same way to figure out what the roll message is.